Multiple Data Sources to Analytical Insights - Part1
Completely automate analytical insight generation from multiple sources without writing any code
In the last blog, we have seen how we can automate creation and publication of visual content keeping the data source manual in the form of excel spreadsheet on OneDrive. However rarely does all the data that we need for our analysis sit on excel spreadsheets.
These days it is common to source data from API's either internal or third-party in addition to the traditional means of sourcing data from databases. Also, with increasing applications of AI/ML, data preparation using R/python before using them for analysis has become a common requirement. In this demo we will use some the most commonly used data sources as examples so that our readers can use this solution in real-world scenarios.
We will also cover how we can completely automate the content creation process right from getting data from multiple data sources to daily publication of content. And yes, without writing any code and at no-cost.
In order to maintain consistency, we will continue to use Power BI as the visualization tool. However, using Power BI has some serious drawbacks as well as some great advantages. Although we will touch upon the advantages and disadvantages of using power BI, the purpose of this blog is to help the reader understand how we can create modern automated data analytics solutions without writing any code. In subsequent blogs we will cover a comparison of the popular tools and which one works best in what scenario.
For the purpose of our demo, we will use a combination of below data sources:
Relational Database. We will use PostgreSQL DB in our example.
Third-party API.
Python Script
In this post, we will cover sourcing data from the above three data sources. In our next post, we will cover how to bring the data from all these sources together to create visual insights that can be shared on the web.
Note: For connecting to databases not hosted on azure, we need to use a desktop version of Power BI which only works on windows OS. Additionally, unless you connect your on-premise/local windows machine/server/virtual machine to the web, you cannot completely automate the data refresh.
So lets get started and create a dashboard - India at a glance sourcing GDP, prices of some key commodities, population from disparate data sources and also generate some custom analysis by combining data from all these sources. All you need to know is how to use excel.
Step 1 - Source the data from multiple data sources
Get data from local/on-premise database
Connect to PostgresSQL DB as shown below.
Specific to postgresSQL, you need npgsql installed, Click here to get the npgsql version 4.0.10 required for Power BI. Make sure you select custom install option - GAC setup as shown below
If you get the below error for SSL certificate, contact your admin to configure PowerBI to accept the connection with database as secure. We strictly recommend not skipping this part for production connections.
For demo purpose, we have skipped the ssl verification by disabling the encrypted connection in data source settings as shown below. However refrain from doing so in production systems.
Once Connect is successful, the dataset will show up on screen. You can transform the data if necessary like we have changed the datatype for date
Get data from third-party API
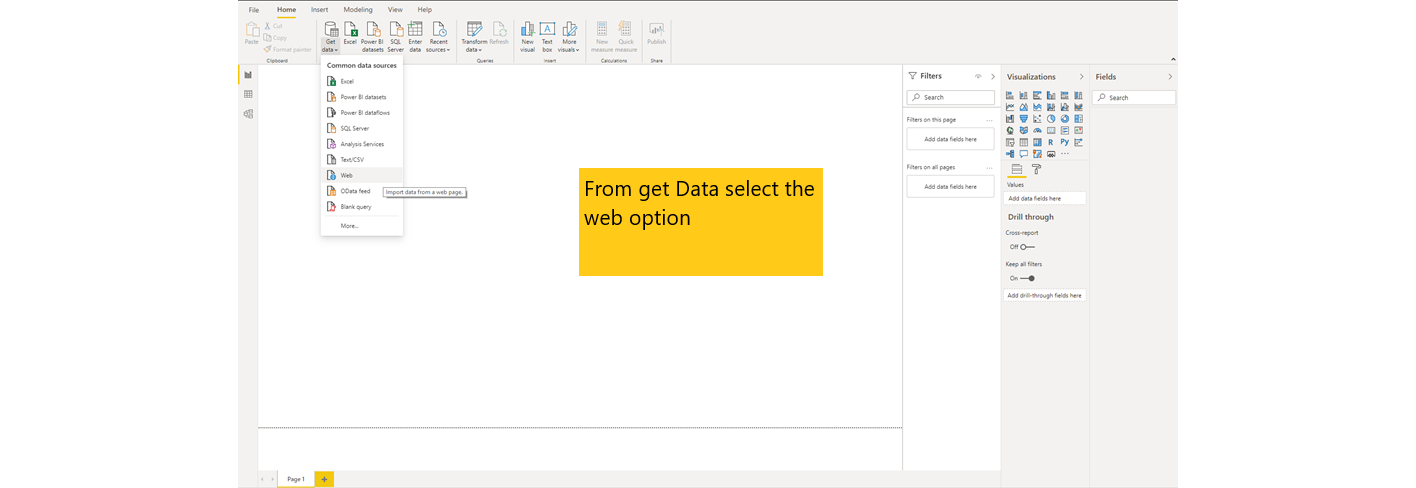
Connect to API source as shown below.
To specify additional parameters to API query, use the advanced options as shown below. Here we have added per page records value. The changes will reflect in URL preview.
Convert the JSON output to table format as show below and you are all set to use the data either on its own or combining the columns with other data sources.
Get data from python script
Connect to python script as shown below.
Power BI will automatically detect python installation. If you need to change the same you can do so as follows from File -> Options and Setting -> Options
Upon successful connect, the navigator window will pop-up. Select the data objects required and transform the data if necessary and load the data.
Continue to part2 of the post to see how we can combine the data we have sourced from the diverse data sources to create a unified analysis and share our visual insights on the web.


