Multiple Data Sources to Analytical Insights - Part2
Completely automate analytical insight generation from multiple sources without writing any code

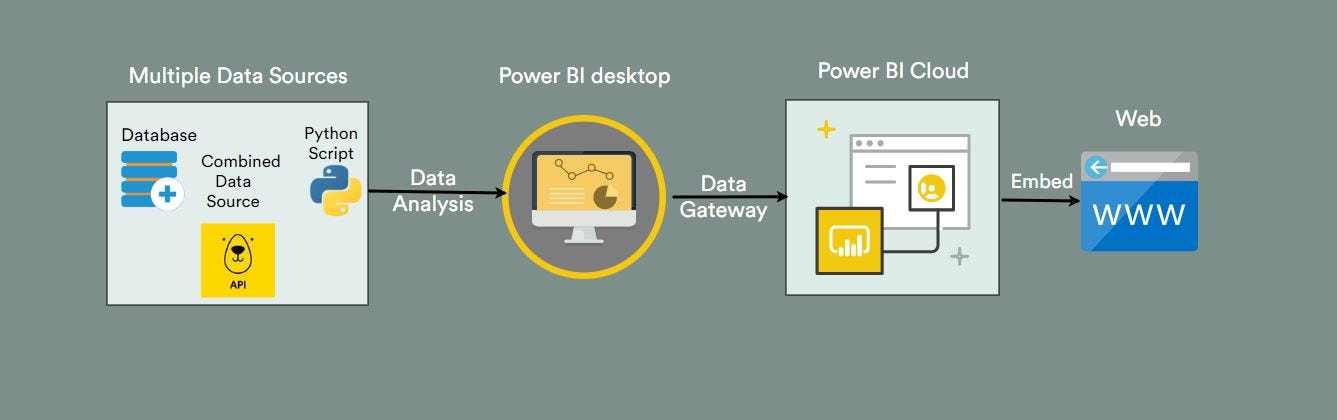
In Part1, of the blog we have seen how to get data from multiple data sources to create a single data view of data for our analysis. In Part2, we will see how we can combine data from all these sources and perform combined analysis and publish the visual insights on the web.
Let us complete our dashboard - India at a glance using four easy steps.
Step 1 - Source the data from multiple data sources (Click to view Part1)
Step 2 - Combine all the data together and perform analysis
Now that we have individually connected to all these sources, it is easy to combine them all and create a visualization.
Once the data is loaded, performing analysis, combining data is as simple as working with excel spreadsheets

You can drag and drop columns and create visualizations. Here in our example, we created a new measure per Capita GDP combining columns from different sources

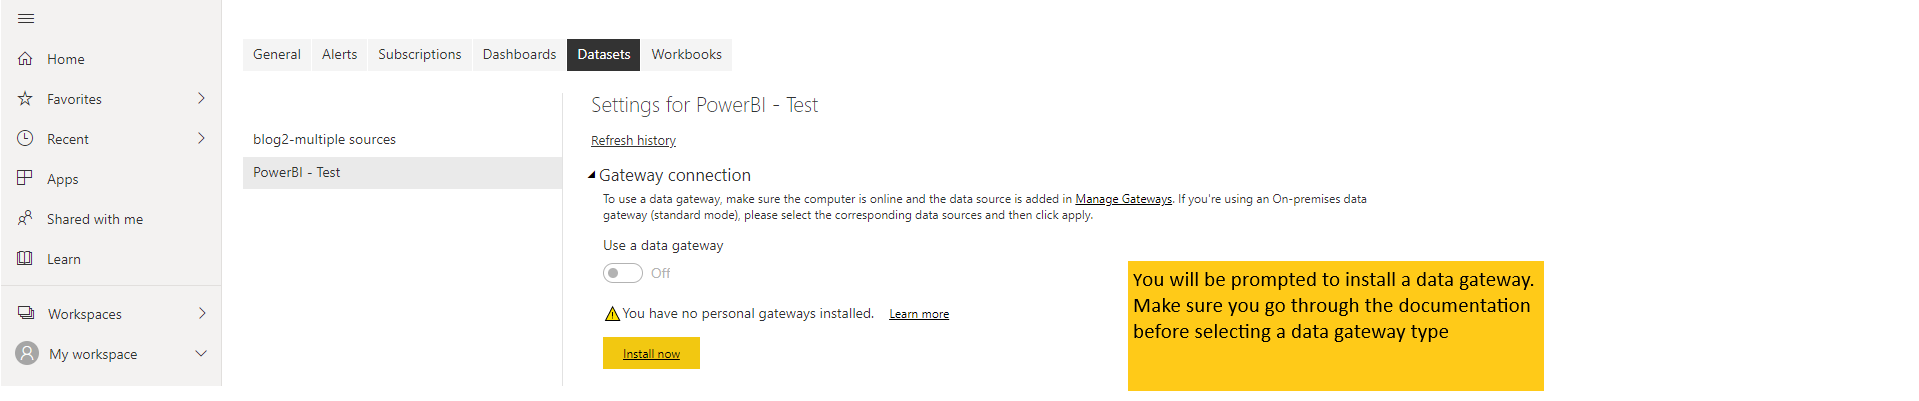
Now publish the dashboard to Power BI service so that it is deployed on the web either by selecting the publish option or by uploading the pbix file to the online version of Power BI. In order to schedule an auto-refresh every time the underlying data changes, we need to establish the data gateway between our local system and Power BI cloud. Check if data gateway exists as shown below


Proceed to next step for help on how to establish a data gateway
Step 3 - Establish a data gateway between your local computer/ on-premise server and Power BI cloud
This step can get tricky and is clearly a pain point while working with Power BI. However this is a one-time activity and once the data gateway is setup between your on-premise/local system and Power BI, it can be used for all your dashboards. You may also skip this step if you wish to refresh your data manually.
Note: Power BI has two types of data gateways - standard and personal and which one to choose can get confusing. Click here to visit the Microsoft documentation on data gateways to know about data gateways.
When you have no data gateway setup between your local system and power BI cloud , navigating to setting-> Manage gateways will show a blank page as below


Although the documentation clearly states the difference between the two, we have noticed that some connection types work only with standard mode and some only with personal. Let us install the standard mode first as it suited for databases. Now if we click on the Manage gateway option, we can see a gateway cluster created. Add a data source to this gateway. We will add our PostgreSQL DB.
Note : If you get any error on adding a database make sure your database is up and running. Contact your database admin if required.


We can see that the other two data sources are still not added to the data gateway. To add our API connection, it is straight forward, just click on the link add to gateway

Now we can see that we still have one more error left, which is the python data source. For this we need to establish the personal data gateway. Download and set up the personal gateway.

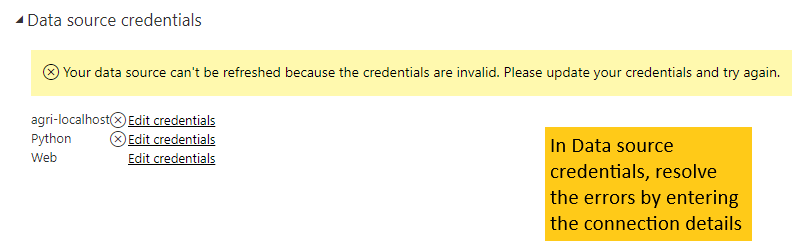
Next proceed to Data Source Credentials as show below. Click on edit credentials for each data source and make sure they are the same as the settings in the desktop version.
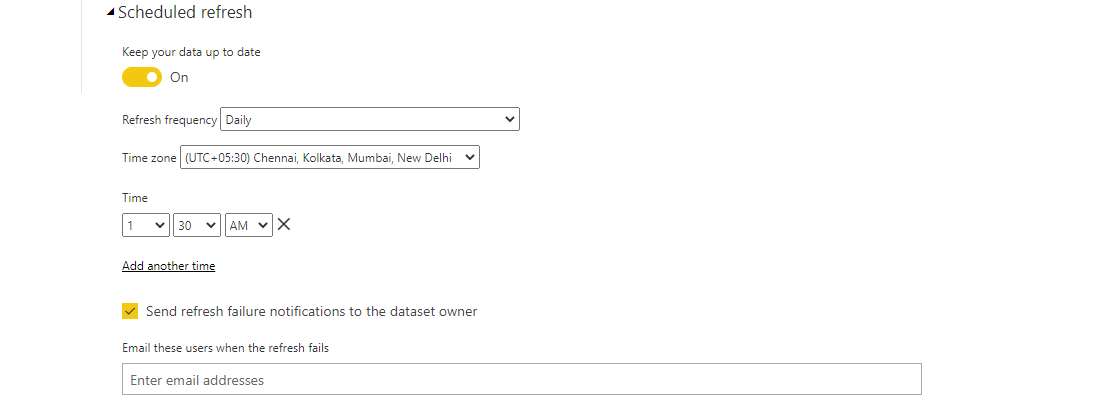
Step 4 - Set up auto-refresh at desired time interval
We can schedule an auto-refresh at desired frequency and time by setting the scheduled refresh as below
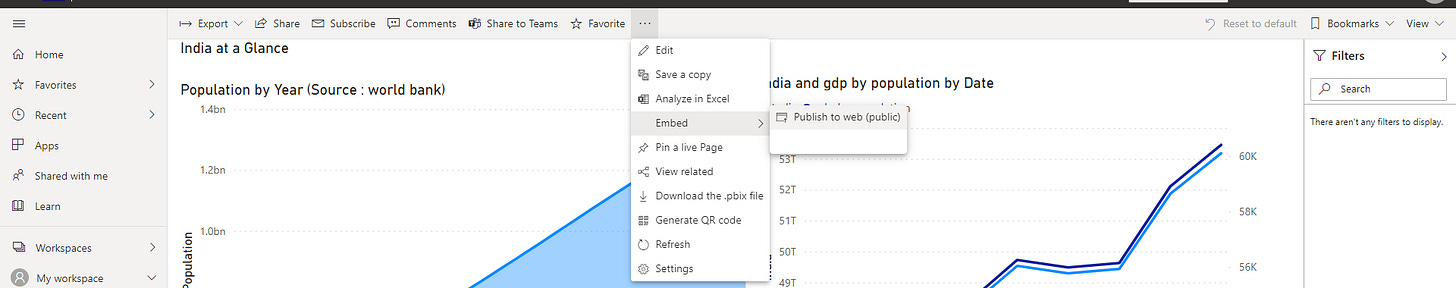
Next publish your dashboard to web as shown below. You can share the report over email by just sending the link. You can also embed the Dashboard on your website by just pasting the iframe code on your website or blog.